

Classifying ancient pottery has traditionally relied on expert judgment. Archaeologists examine features like the wall’s curve, the rim’s shape, and the base’s angle to determine a vessel’s type.
Although useful, this method remains subjective because experts may disagree when classifying the same piece, while the criteria themselves were never designed for objective measurement or testing.
A research team from Nagoya University and University College London developed a deep learning system that uses a completely different approach. Rather than relying on visual judgment, it classifies pottery based on its complete 3D shape while also providing an explanation for its classification.
The pottery in discussion
The study focuses on Sue ware, an non-glazed stoneware produced in Japan from around the 5th to the 10th century. Made on a potter’s wheel and fired at high temperatures in tunnel kilns, Sue ware had more standardized shapes than handmade ceramics. This consistency made it particularly suitable for studying pottery morphology.
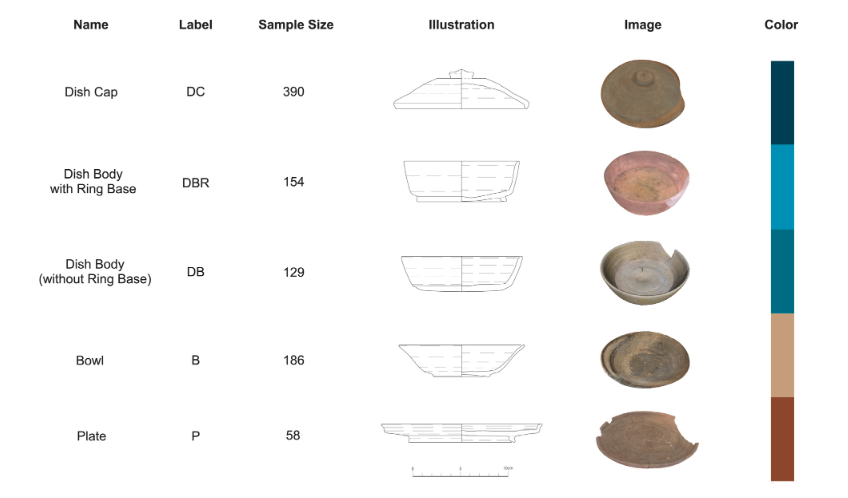
The researchers then examined 917 vessels from the Sanage kiln in Aichi Prefecture, one of ancient Japan’s two major Sue ware production centers. The vessels were divided into five established types: Dish Cap, Dish Body with Ring Base, Dish Body, Plate, and Bowl. All the samples date from the 8th to the mid-9th century, a period that plays an important role in interpreting the study’s results.
Training data
A key difference in this study is that the researchers did not train the model using photographs or flat outline drawings. Instead, they represented each vessel as a 3D point cloud, a collection of coordinates that captures its entire surface geometry. The team created these point clouds using optical scanning and photogrammetry, then reduced each vessel to exactly 1024 points before feeding the data into a model called Point Transformer, which was originally designed to recognize 3D shapes.
Thanks to the use of point clouds, the model could work with the vessel’s full three-dimensional form. Traditional 2D profiles only show a single cross-section, which can miss important details such as how the walls curve or how the base transitions into the body. This limitation had caused problems in earlier studies, where visually similar 2D outlines made some borderline vessels difficult to distinguish. By using the complete 3D shape, the new model could capture differences that a flattened image could not.
Model performance
The model performed strongly across the five pottery categories, achieving an overall macro F1-score of 0.9320 in five-fold cross-validation. Three categories were classified with near-perfect accuracy: Dish Cap achieved an F1-score of 0.9975, Dish Body with Ring Base scored 0.9766, and Plate reached 0.9761.
However, the model found two categories more difficult to distinguish. Dish Body had an F1-score of 0.8317, while Bowl scored 0.8779. The confusion matrix helps explain these lower scores. 18 true Bowls were classified as Dish Body, while 22 true Dish Bodies were classified as Bowls, making confusion between these two categories the largest source of error in the dataset.
Understanding the model’s struggle
The model’s weakest results may actually reveal something important about the pottery itself. Japanese Sue ware scholars generally associate Dish Body vessels with nearly vertical walls, flat bottoms, and lids, and believe people used them for eating with their hands. Bowl vessels, by contrast, had more gently curved walls and no lids, and became more common as people began using spoons and chopsticks. Historical evidence suggests that this change happened gradually rather than suddenly, and the 8th to mid-9th century period represented in the dataset falls directly within this transition.
This provides a possible explanation for why the model struggled to distinguish the two categories. Rather than simply making mistakes, it may have been detecting the fact that Dish Body and Bowl shapes were genuinely difficult to separate during this period. A PCA visualization of the model’s learned features supports this interpretation. While the other three categories formed relatively distinct clusters, Dish Body and Bowl samples remained substantially overlapping even after training.
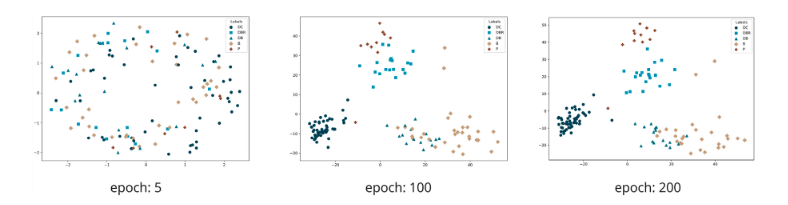
This suggests that the two types may not have had a clear morphological boundary at the time, meaning the model’s confusion could reflect a real ambiguity in the pottery itself rather than a weakness of the classification system.
Black Box No More
Researchers often describe deep learning models as “black boxes” since they can make decisions through processes that are difficult to understand. The team addressed this by developing several ways to examine what the model was actually learning. Alongside the PCA visualization, they used a hierarchical clustering dendrogram to show how the model grouped vessels based on similarities in shape. They also adapted Grad-CAM, a technique originally designed for 2D images, into a 3D version that highlighted the specific points on a vessel’s surface that influenced each prediction.
The clearest evidence came from six vessels that sat on the difficult boundary between Dish Body and Bowl, including examples that human experts had already found challenging to classify. The model correctly classified five of the six. More importantly, the 3D saliency maps showed where the model was looking when it made those decisions. For Dish Body predictions, its attention was concentrated around the rim and the steep inner slope near the base. For Bowl predictions, it shifted toward the outer surface and base, paying less attention to the rim.
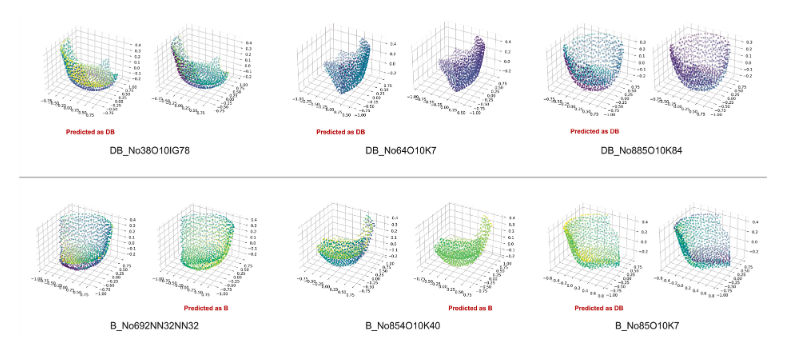
What makes this especially interesting is that the model was not looking at the pottery in some completely foreign way. Its attention fell on many of the same features an archaeologist would examine by eye. The difference is that the model could show exactly where those decisions came from. Instead of simply saying “Dish Body” or “Bowl,” it offered a glimpse into the shape features behind the answer, turning what could have been a black-box prediction into something researchers could actually interpret.
Further applications of the tool
The researchers see the model as more than a way to validate existing pottery classifications. The same kind of 3D shape fingerprinting could also help archaeologists trace where a vessel was produced. Previous studies have identified production sites by examining small features, such as the shape of a knob or rim. By applying the model to pottery from multiple kiln sites across Japan, researchers could use these subtle differences to trace how vessels moved from their production sites to the communities that eventually used them.
Another advantage is that the approach does not require an enormous amount of computing power. Training the model took around five hours on a single consumer-grade GPU, meaning it did not depend on specialized supercomputers.
The limits
There are, however, some limitations to the approach. It works best with open-shaped vessels such as bowls and dishes, since optical scanning cannot capture the interiors of closed forms like jars and jugs. Studying those would require techniques such as X-ray CT scanning. The model is also supervised, meaning it learns from categories that researchers have already established. It can test those categories, reveal where they overlap, and potentially challenge them, but it cannot create an entirely new typology by itself. The dataset also contained 917 vessels, a number that many archaeological projects may struggle to match for a single pottery type.
Even with these limitations, the study points toward a real shift in how pottery can be studied. Rather than relying entirely on expert judgment or treating AI as a system that just produces an answer, the researchers show that 3D shape itself can be measured, classified, and interpreted. With the code and full dataset now publicly available, other researchers can apply the same approach to different pottery traditions, regions, and time periods, opening the door to a more measurable and transparent way of studying ancient ceramics.
Tatsuda, W., Hori, R., Morikawa, K., & Inoue, H. “Deep learning-based morphological classification of ceramics: A case study of 3D point cloud analysis for Sue ware, Japan.” Journal of Archaeological Science, Vol. 187 (2026), article 106472. doi.org/10.1016/j.jas.2026.106472
